Read the results
Every check writes its results straight into the channel grid, into the details of each channel and into the console. This lets you see at a glance which channels work, how good they are and which ones need you. Follow these steps to read the results.
Steps
- Open the Checker: Open your playlist and click Checker in the row of tabs under the top bar.
- Read the summary on top: Four boxes show how many channels are Working, Not working and Not checked yet, and when the Last check ran and the next one runs. Click a box to list only those channels below; click it again to see all. Next to them, Groups — worst first shows each group with a bar of how many of its channels work; click a group to open it. Under the boxes, Since the last check names the channels that stopped working or work again. Hide summary folds it away and the list gets the room.
- Look at the grid: Each row shows a status dot at its left and the columns Quality, FPS, Reliability, Latency and Last check. Point at a column name to see what it means.
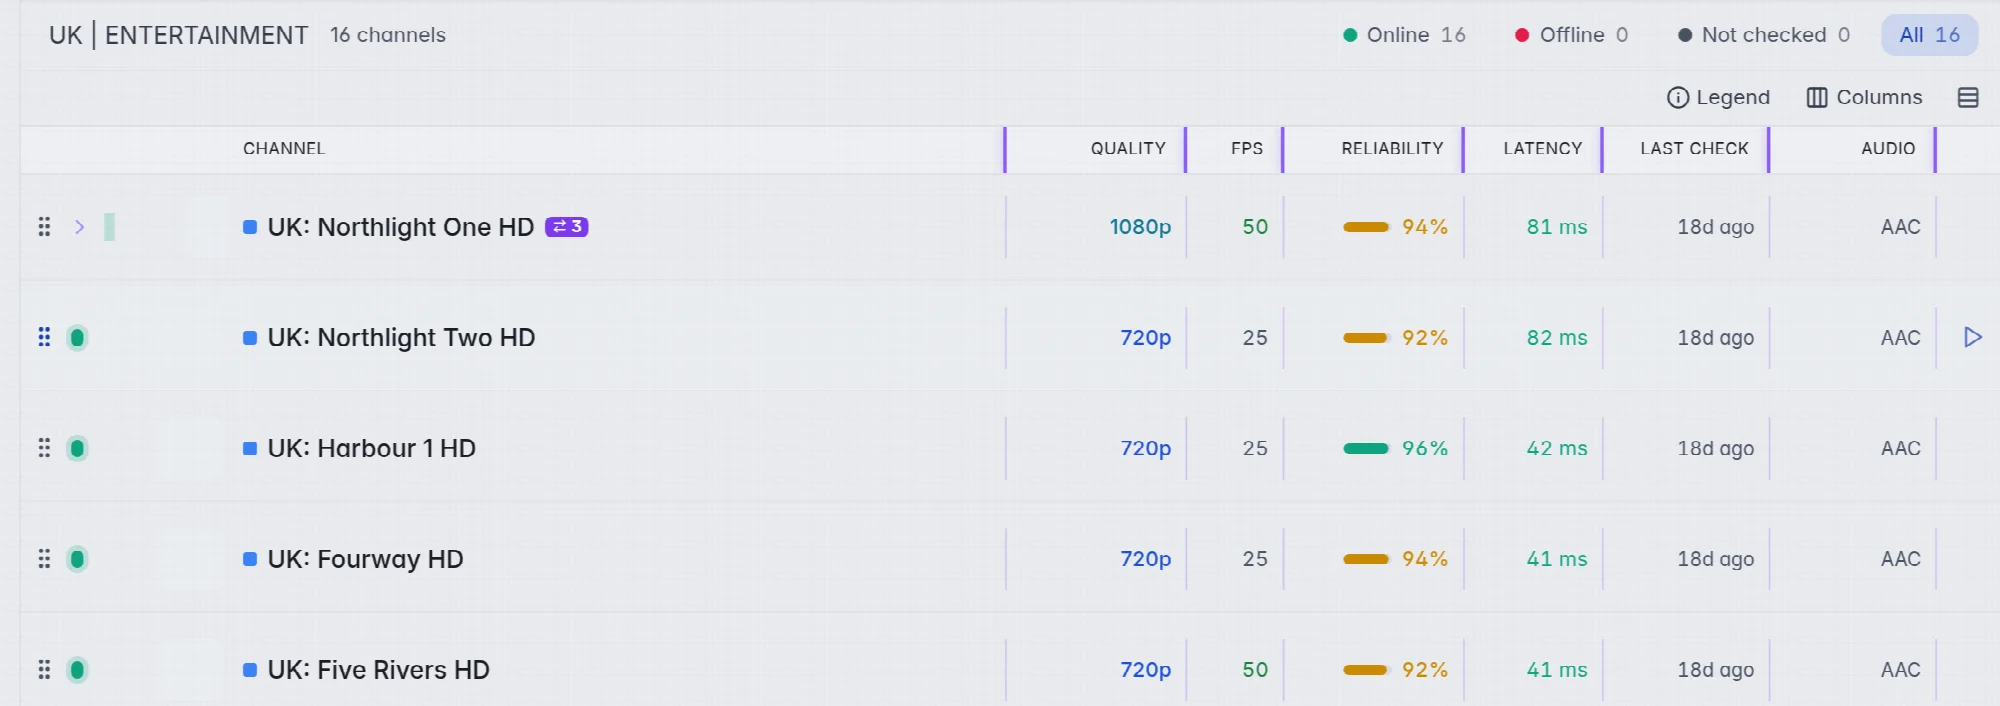
- Filter by status: Click Online, Offline or Not checked above the grid. The number next to each shows how many there are. Click All to see everything again.
- Open a channel: Click a channel to see its details on the right: the status with quality, frame rate, codecs and resolution, and the Reliability bar with the number of checks it passed, for example 34 of 36 checks.
- Open the statistics: Click the console bar at the bottom of the editor, then click Stats.

The columns
| Column | What it tells you |
|---|---|
| Status dot | Green is online, red is offline, grey is not checked yet. |
| Quality | The resolution the stream delivered, for example 720p. 1080p and 4K are coloured. |
| FPS | The frame rate. 50 is smooth for sport, 25 is normal TV. |
| Reliability | The share of checks this channel passed. Green is 95% or more, orange 70% to 94%, red below 70%. |
| Latency | How fast the stream answered. Green is under 800 ms, orange under 2,000 ms, red slower. Streams that answer slowly tend to buffer. |
| Last check | How long ago it was tested, for example 2h ago. |
Tip: Click Columns above the grid to add Res (the exact resolution), Audio (the sound codec) or Last played (when a customer last watched it). Click Legend to see what the colours of the dots and rows mean. Under Colours in the columns it also explains the column colours: Quality 4K and 1080p stand out; Reliability green 95% and up, orange 70–94%, red below 70%; Latency green under 0.8 s, orange under 2 s, red slower; Audio 5.1 and 7.1 stand out.
The statistics
The Stats tab of the console sums up the whole playlist:
- channels in this playlist: One bar with how many are working, not working and never checked.
- of tested channels work: The share of checked channels that play.
- of the playlist is tested: How much has been checked at all.
- Since the last check: How many channels came back and how many went dead. It only shows when something changed.
- Quality of the working channels: How many of the working channels are 4K, 1080p, 720p and so on.
Other places to look
- The top bar: Next to the playlist name you see three numbers with a dot each: online, offline and not checked, for the whole playlist.
- The groups: The line under each group on the left shows how much of it works: green for online, red for offline.
- Filters: Click Filters in the top bar to show only one Quality, or open More filters and set Min fps or Min reliability. Example: Min reliability 90 shows only streams that pass 9 checks out of 10.
Good to know
- One check is a snapshot. Reliability becomes useful after a few checks, because it shows a trend.
- Note: Clear all check results under Tools, Careful, clears every check result of the playlist. It asks first. Every channel is then Not checked again.
- What to do with offline channels is in Not working channels.